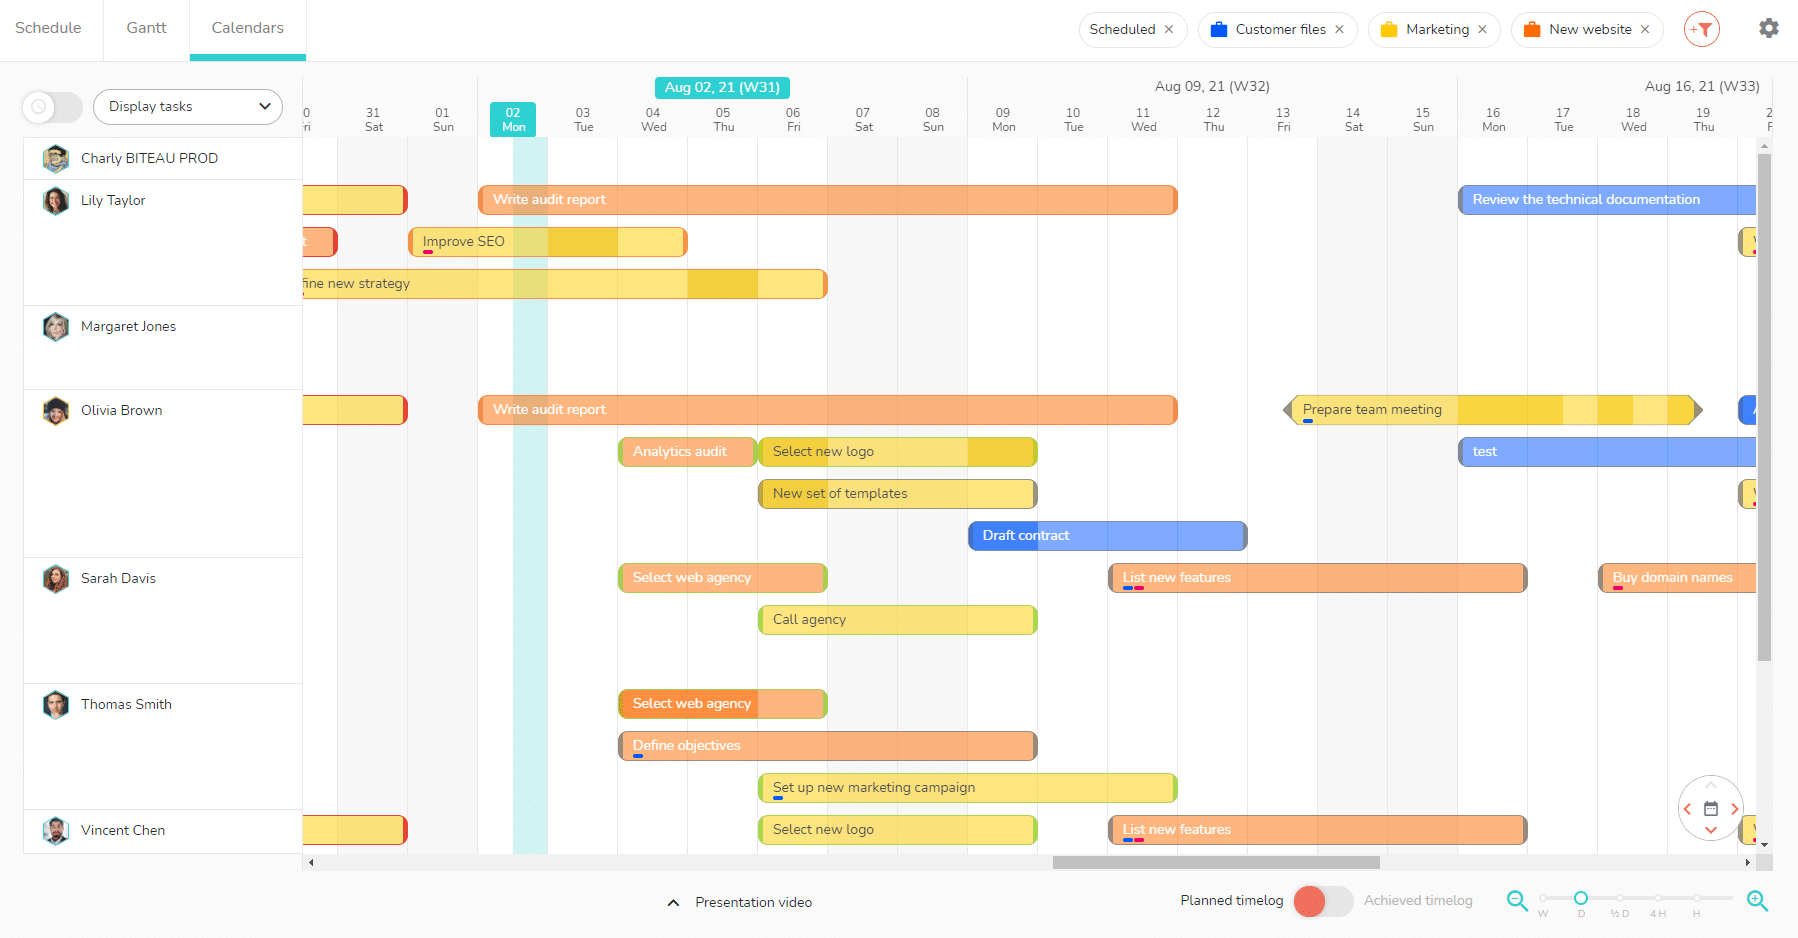
Multi-projects > Calendars view: The multi-projects Calendars view displays all of your team member’s tasks over time. The display is optimized by displaying tasks in a parallel way.
You can perform several actions, you will find the list below.
- Display and plan several projects
- View planned and achieved timelogs
- View the status of tasks
- Display time
- Schedule workload
- View occupancy rates
- Display time tracking report
- Change display settings
Display and plan several projects
When you arrive in one of the multi-project views, if no project is selected, you will be asked to select one or more projects to display. You can then modify this selection with the filters.
Hover your mouse on a task to display several information:
- Project, task list and task’s name
- Start and end dates and duration of the task
- Assigned members
- Task progress percentage
Click on the task to access the details panel (What tab) of the task.
You can continue to schedule, expand, or reduce the duration of a task in multi-projects views. If applicable, Beesbusy will take working hours, links and milestones of each project into account.
View the planned and achieved timelogs
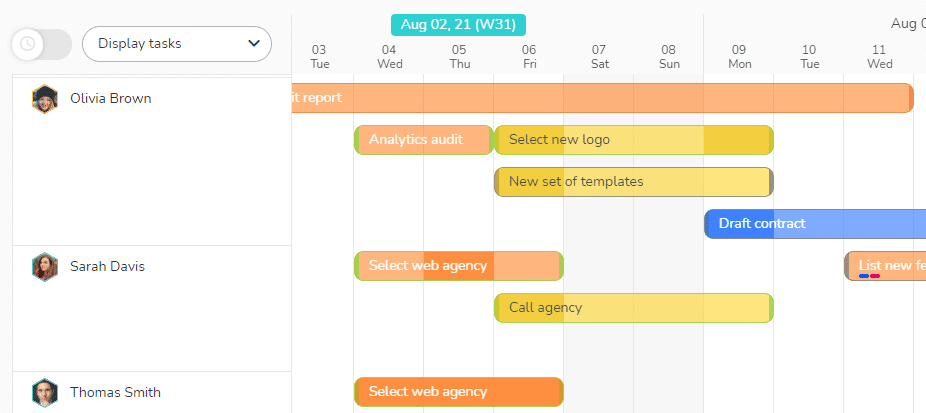
The Multi-Project Calendars view enables you to view the planned and achieved times for each task. To do this you need to check (at the bottom of the screen) the timelogs you want to display in your Gantt chart.
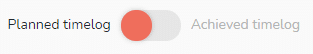
Planned or achieved timelogs are visible by a darker color on the tasks.
View the status of tasks
A color code is used to display the status of tasks according to their schedule:
- Red: late
- Orange: in progress
- Gray: upcoming
- Green: completed
You can reinforce this display in the options of the multi-project views.
Display time
Schedule workload
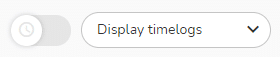
By selecting “Display timelogs” in the « Who » view, you can schedule workload to a member.
For each member, you have the time slots (corresponding to the duration of the task) on which you can schedule their workload. These time slots are shown by colored areas (the color of your project).
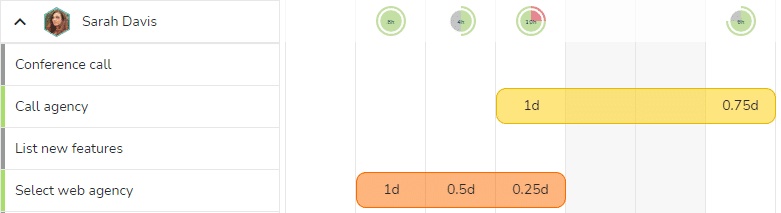
View occupancy rates
The occupancy rates are visible on the member’s line and correspond to the member’s occupancy rate per day on all the projects on which he is assigned. In workload planning, the occupancy rate allows you to see if a member is available and for how many hours, but also if you have planned too much workload for them.
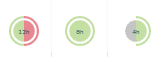
The colors of the occupancy rates are:
- Green: planned workload
- Grey: workload available
- Red: workload exceeding the length of the member’s day
Display the times tracking report
You can use the toggle 

Visit this article dedicated to the display of time to learn more.
Change display settings
- Use the filters

- Use the calendar icon

- Adjust the zoom level with the slider and the icons


- Multi-projects views >


