Project > When view: This view allows you to display and organize your tasks in a timeline. This view is the representation of a Gantt chart.
You can perform several actions, you will find the list below:
- Plan a project
- Create and schedule a task
- Reschedule, extend or shorten a task
- Create a sequence of tasks
- Create links and fixed links between tasks
- Create milestones
- Create links and fixed links between tasks
- Display task status
- Display overtime
- Display planned and achieved time logs
- Timesheet display
- Change display settings
- Print schedule as PDF
- Export schedule to Excel
- Generate Buzz to project members
Plan a project in the When view
Note: Changes made in one view are automatically carried over to the other views of the project (What and Who).
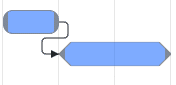
Create and schedule a new task
Use the “New task” field below the task list to add a new task to the project. Once you have typed the name of the task, hit “Enter” or click on the “+” 
Schedule an existing task (not yet scheduled) directly in the schedule. On the line corresponding to this task in the schedule, click on the start or end date of your task: 
Once this task is added to the schedule, you will be able to change its duration.
Reschedule, extend or shorten a task
To modify the duration or dates of a task directly in the schedule:
- To reschedule a task, use drag-and-drop
- To extend or shorten a task, position your cursor at one end of the task and use the handles to change the duration
If this modification affects one or several linked tasks, these tasks are automatically moved. If a milestone task prevents moving, this limit is indicated by an orange zone.
To modify the duration or dates of a task in the task details panel:
Click on a task in the schedule to display the When tab of the task details window. You can then change the dates, times and duration.
Create a sequence of tasks
Create links and fixed links between tasks
Use the links between the tasks if the tasks must be carried out in a specific order. For example, if task B cannot start until task A is completed. Use fixed links if the duration between tasks is a fixed and non-compressible period.
Links and fixed links :
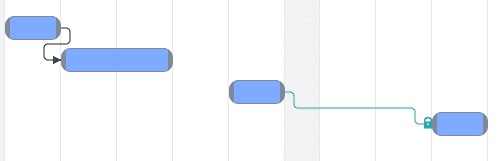
To learn more, read our article dedicated to links.
Create milestones
Milestones are important steps in a project. They mark a deadline, a stopping point in a process. It can be a delivery date, a step requiring validation…
To learn more, read our article dedicated to milestones.
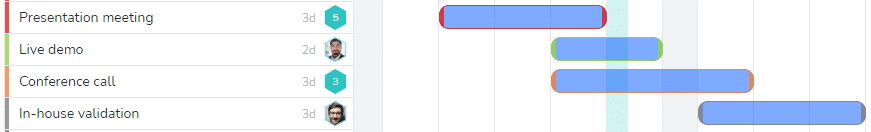
Display task status
A color code is used to display the status of tasks according to their schedule:
- Red: late
- Orange: in progress
- Gray: coming soon
- Green: finished
In the « When » view, the colors of the task status are displayed as follows :
Change display settings
- Click on the drop-down menu above the to-do list to choose the view that suits you best:
- Chronological order: your tasks are presented in chronological order. Unscheduled tasks are at the bottom.
- Task list – chronological order: your tasks are presented using the segmentation by to-do list you’ve set up in the What view. Tasks are arranged in chronological order within each task list.
- Task list – What view order: your tasks are presented using the segmentation by task list that you’ve set up in the What view. Tasks are sorted in the order they appear in the task lists in the What view.
- Task list, custom order: your tasks are presented using the segmentation by to-do list you’ve set up in the What view. You can drag and drop them into any order you like.
- Customized order: your tasks are presented without the task list segmentation. You can drag and drop them into any order you like
- Use the filters

- Use the calendar icon

- You can also use the mini-map

- Adjust the zoom level with the slider and the icons


- Project >


Setting up an initial Gantt version
The Gantt version feature lets you define the basic schedule for a project by clicking on the button 
You can create new, updated versions and compare their progress with that of your initial project.
To find out more, see the Gantt Version online help article. Gantt version
Generate the schedule in PDF
If you want to share your planning outside Beesbusy, you can make a PDF print.
See the article Generate a PDF of your project schedule to find out more.