The multi-project Gantt view
To access the multi-projects Gantt view, click on “Multi-projects” on the left column, then on the “Gantt” tab:
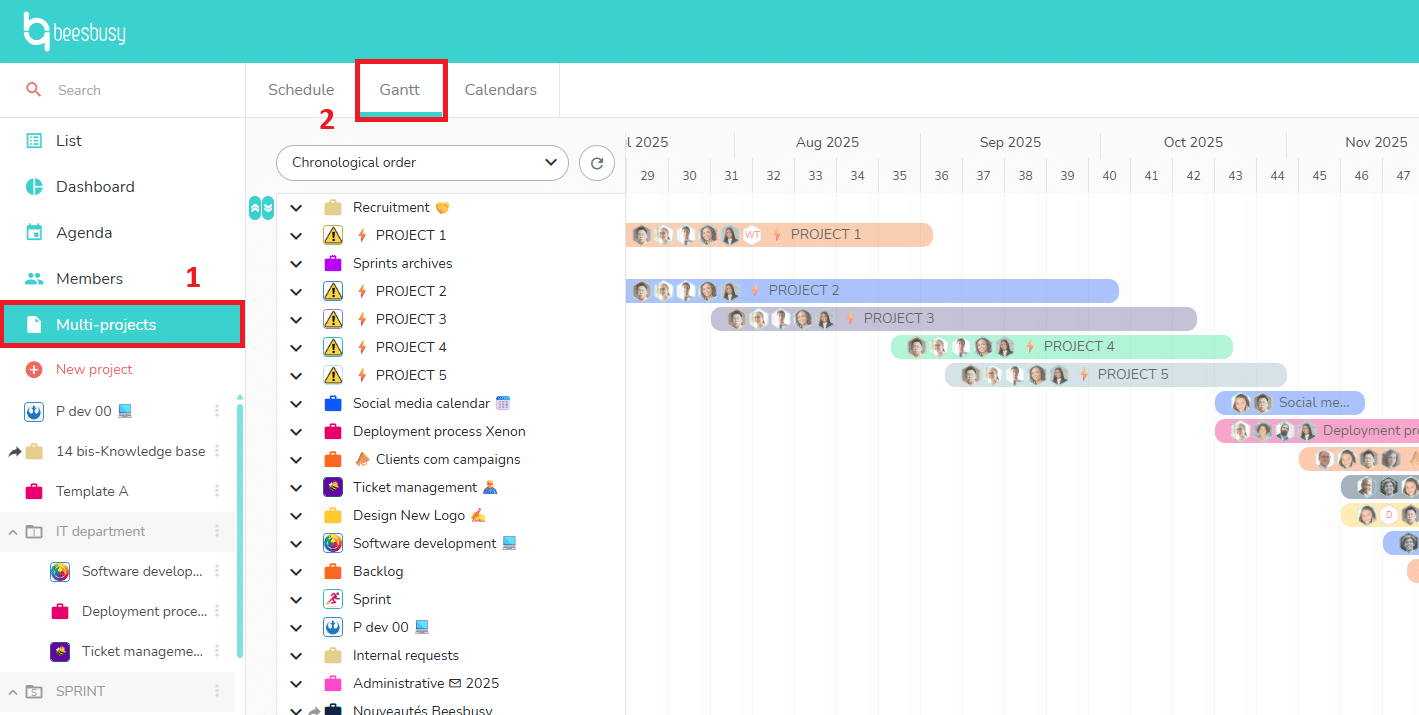
The multi-projects Gantt view displays all your projects’ tasks in a Gantt chart.
This view allows you to view all tasks in chronological order of occurrence, project by project:
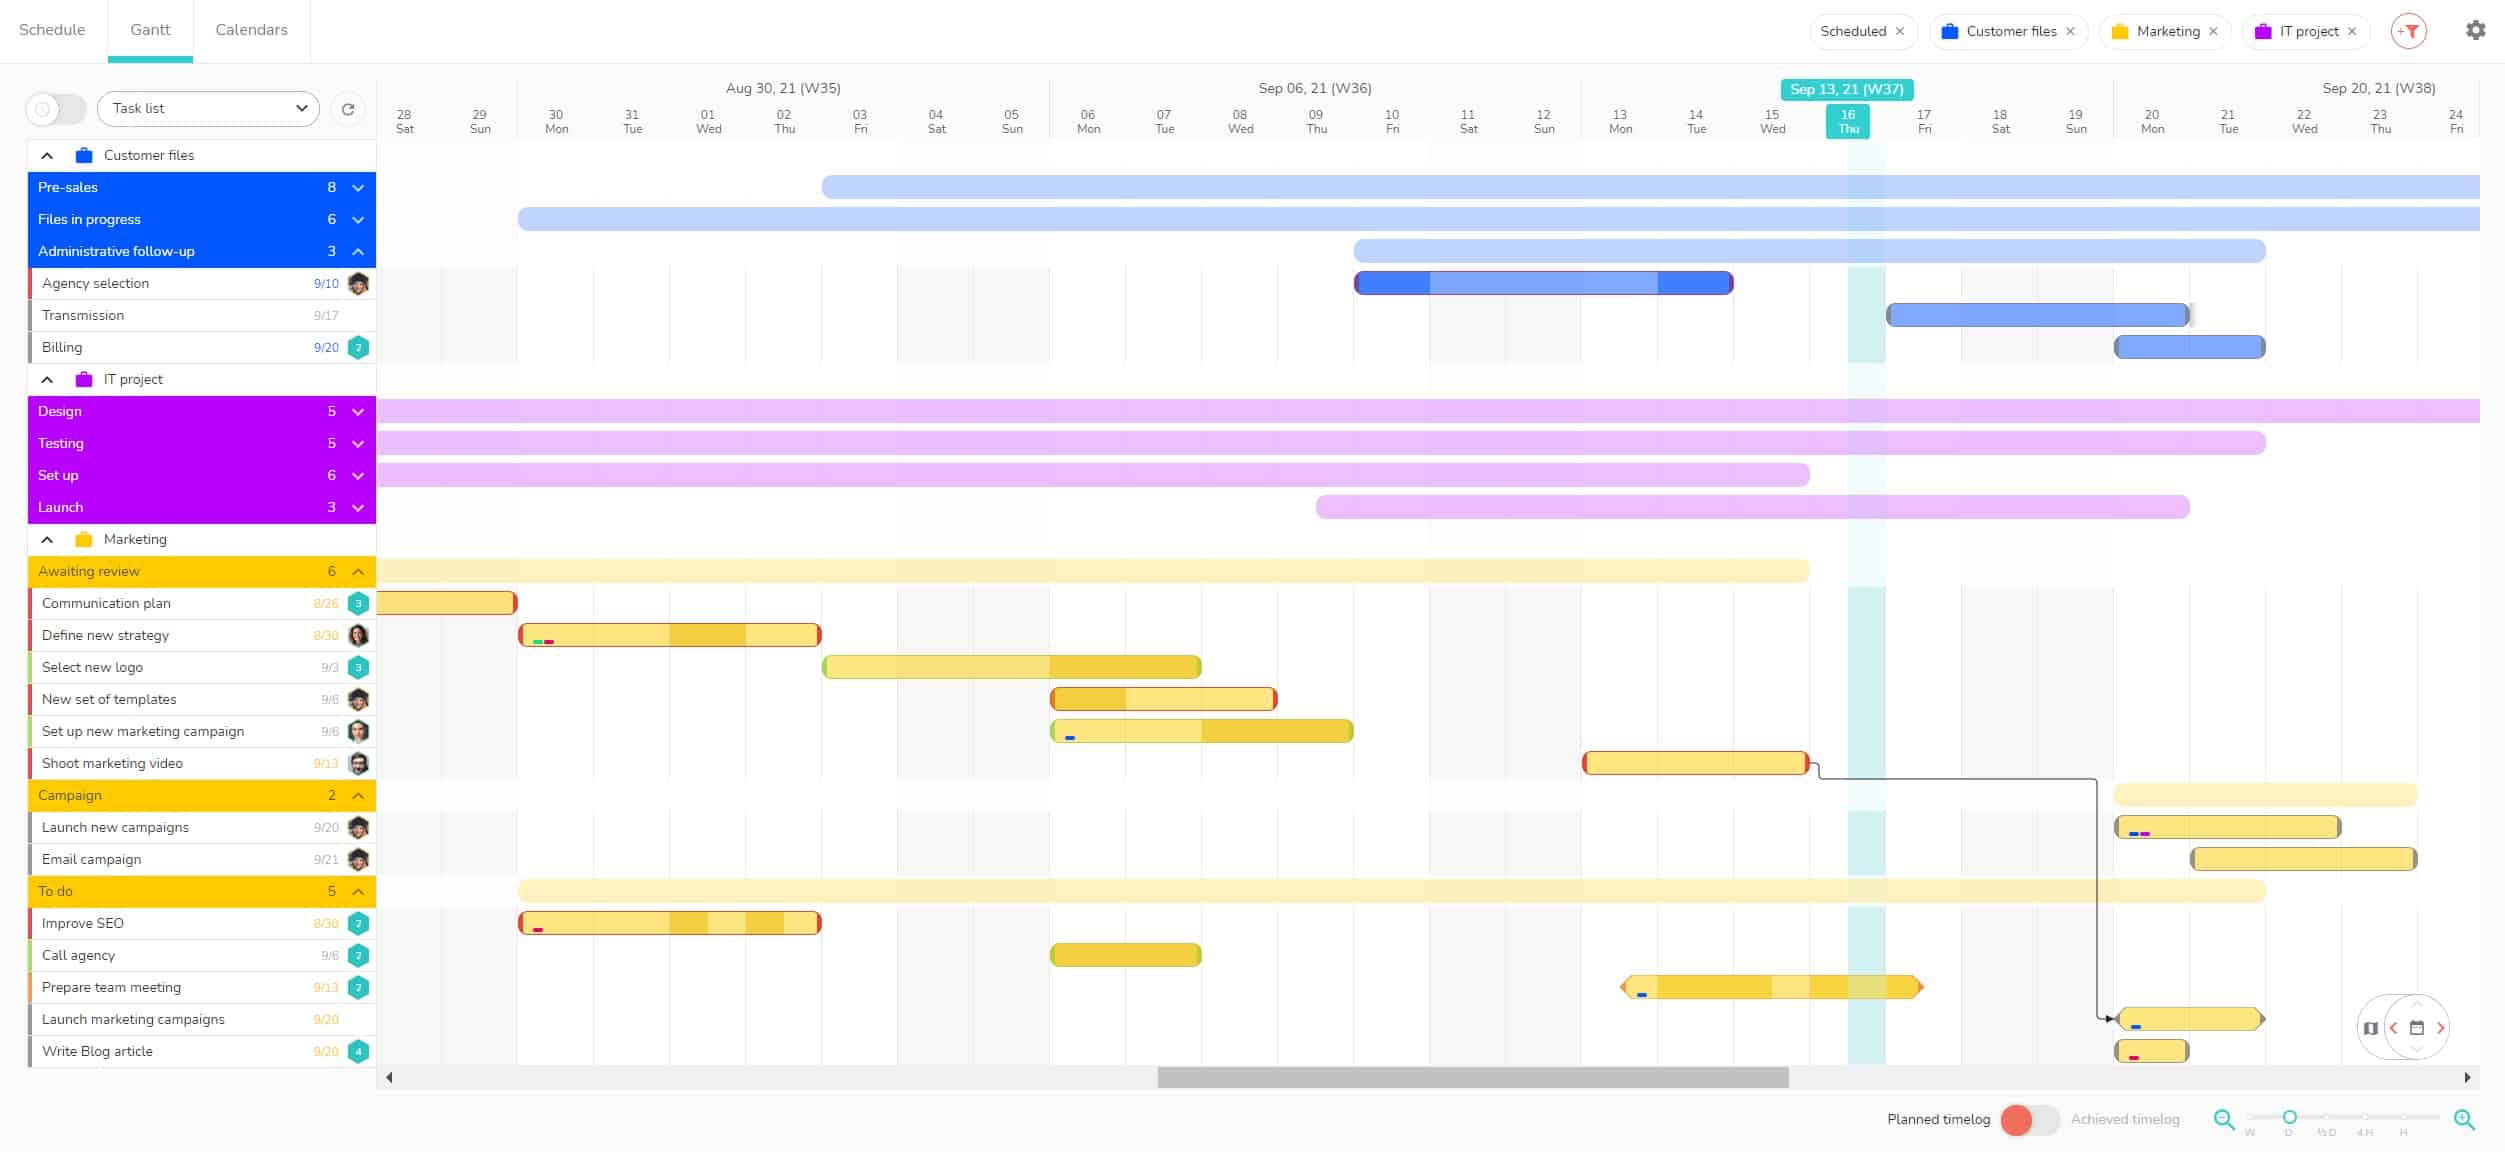
The drop-down menu at the top left allows you to view this Gantt by task number, or by task list as here:
You can perform several actions:
- Display and plan several projects.
- View the status of tasks.
- Display time tracking report.
- Change the display of the tasks.
- …
Display and plan several projects
When you arrive in one of the multi-project views, all your project are displayed by default. You can then modify this selection with the filters.
Hover your mouse on a task to display several information:
- Project, task list and task’s name.
- Star and end dates and duration of the task.
- Assigned members.
- Task progress percentage.
- …
Click on the task to access the details panel (What tab) of the task.
You can continue to schedule, expand, or reduce the duration of a task in multi-projects views. If applicable, Beesbusy will take working hours, links and milestones of each project into account.
In this view, you can also visualize and create links between tasks. Please note that you can only create a link between two tasks if they belong to the same project.
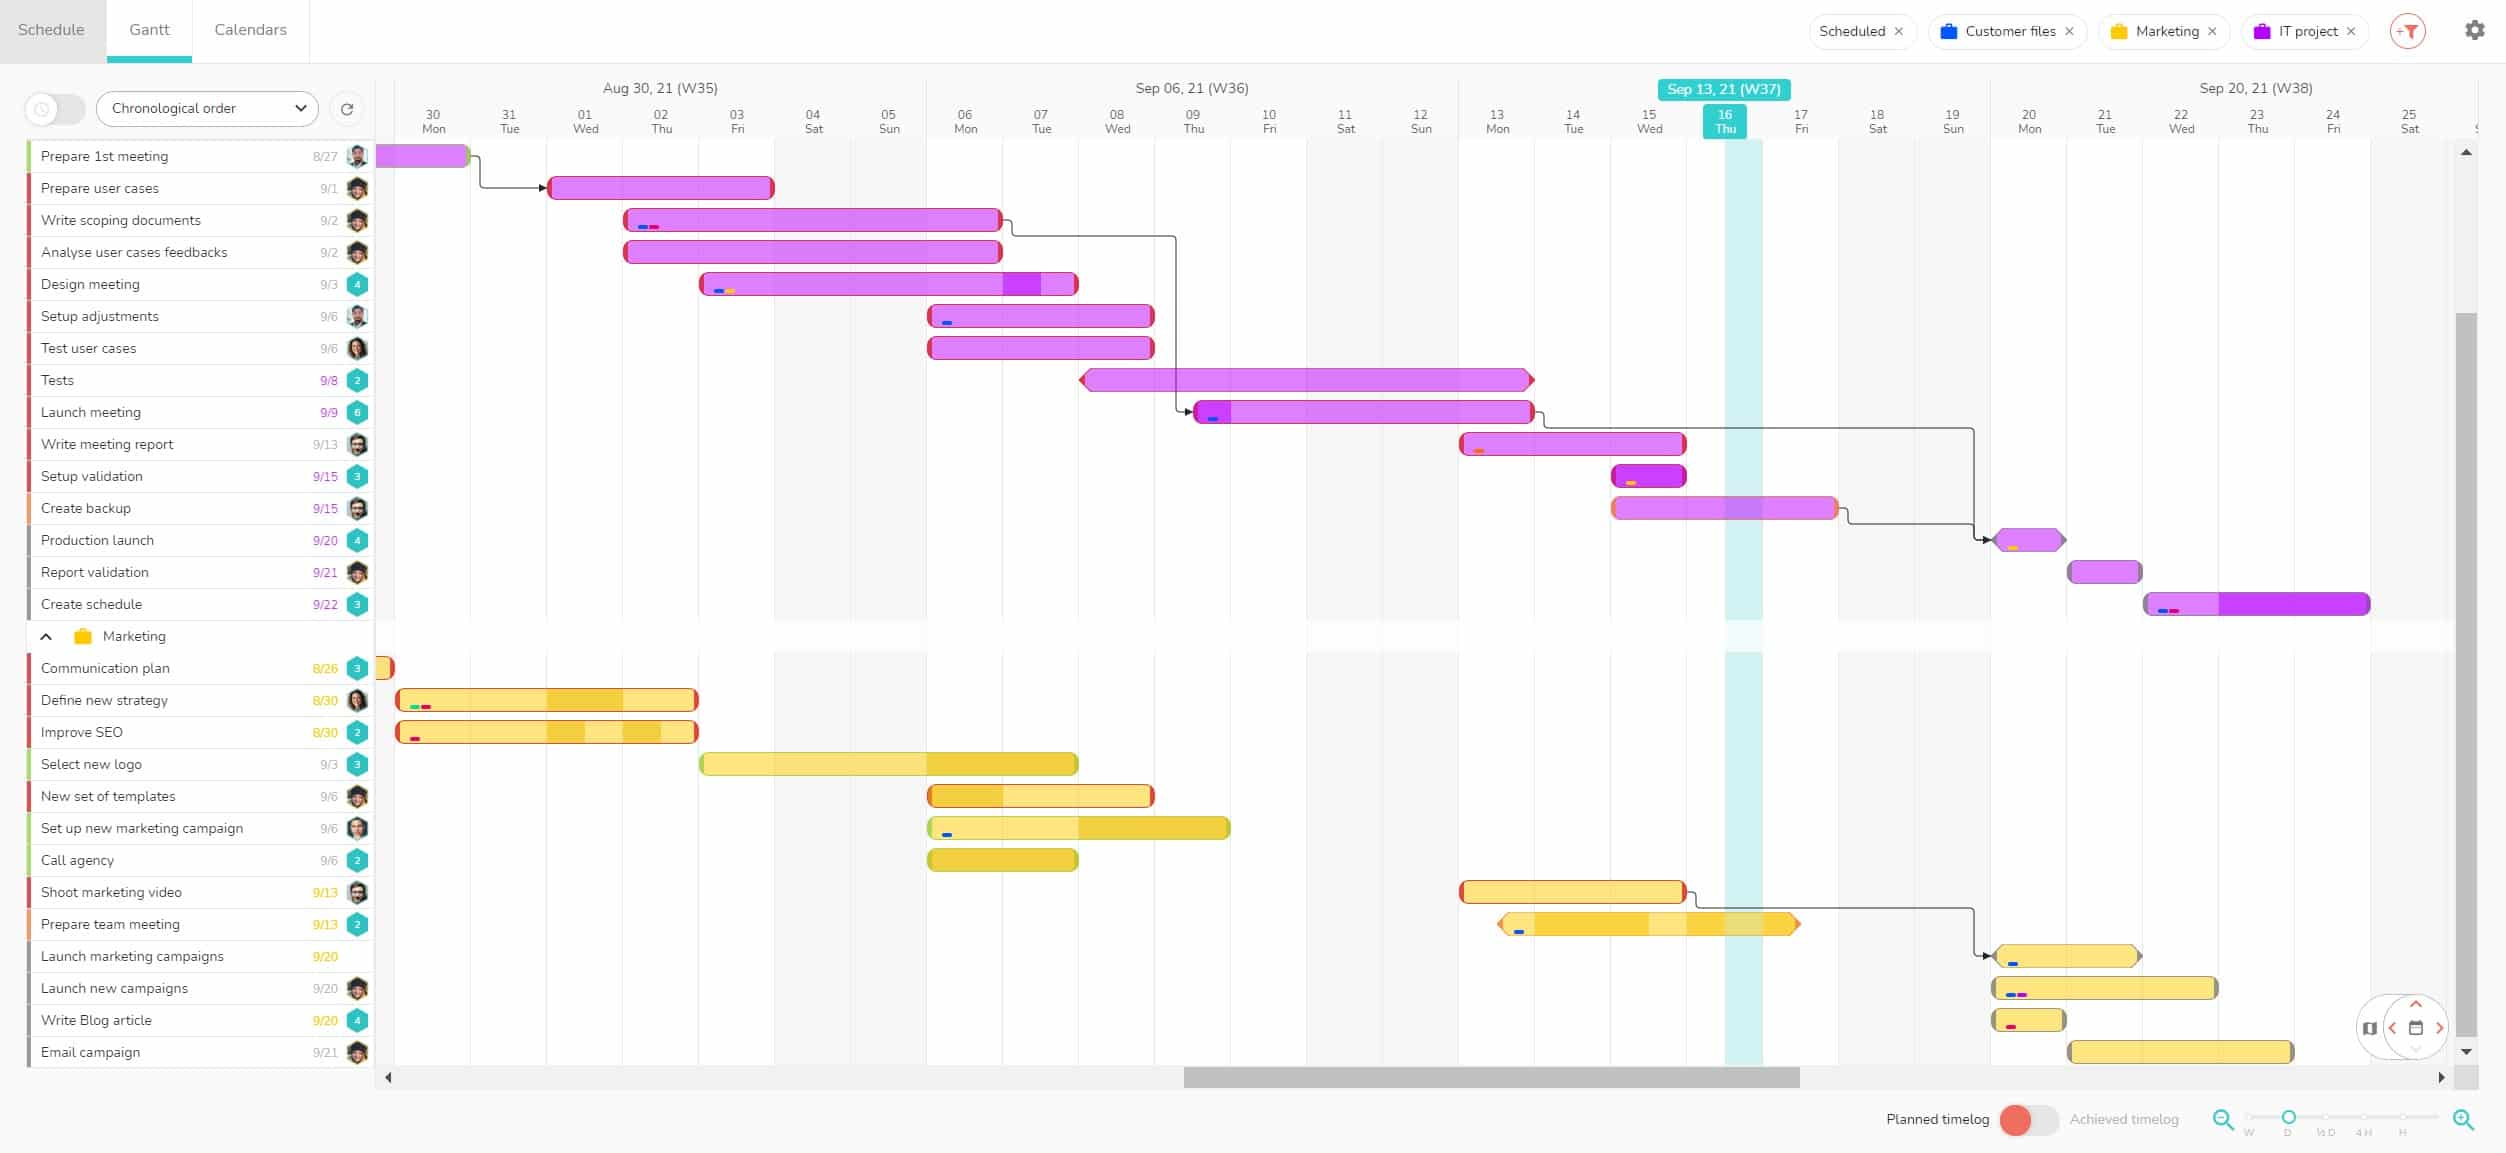
View the status of tasks
A color code is used to display the status of tasks according to their schedule:
- Red: late
- Orange: in progress
- Gray: upcoming
- Green: completed
Time tracking report
You can use the export button at the top right to export all the tasks with their times.![]()
Visit this article dedicated to the display of time to learn more: https://www.beesbusy.com/resources/features/time-management/time-display/
Change the display of the tasks
- Use the filters at the top right to customize the display (by project, member, smart-tags, task status, labels…).
 To know more about filters: https://www.beesbusy.com/resources/features/display/filters/
 - Use the calendar icon at the bottom right to choose a display date and the arrows to navigate.

- You can also use the mini-map to the left of the calendar to see your whole project.
 Click on a specific area to display it.
 - Adjust the zoom level with the slider and the icons at the bottom right.

 . To know more about the zoom: https://www.beesbusy.com/resources/features/display/zoom-planning-views/
 - Click on the settings gear icon in the top right corner of the window to customize display options. For more information, please read the article dedicated to display options of the multi-projects views: https://www.beesbusy.com/resources/features/multi-projects/display-options-multi-projects-views/