To access your statistics, go to Dashboard > Individual, then toggle the button 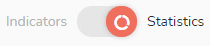
Using the filters 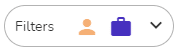
- The statistics of your professional projects are in purple
- The statistics of your personal projects are in beige
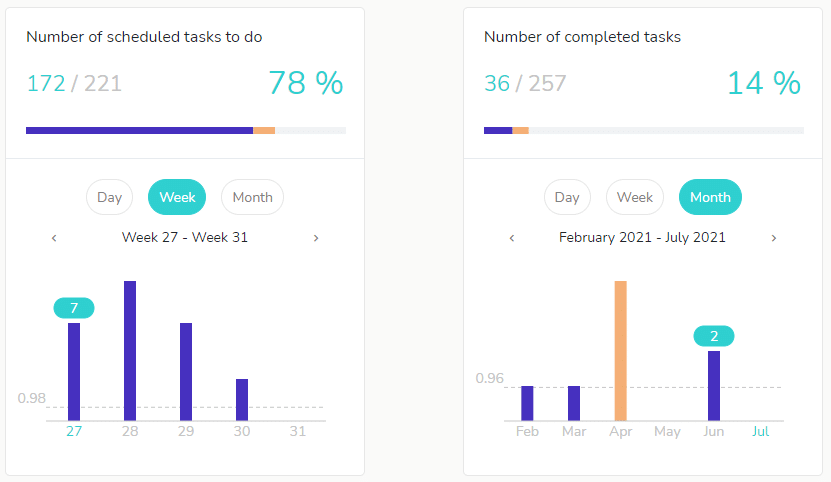
You can adjust the settings of some statistics in order to choose a time frame (day, week, month) and use the arrows to display the period that interests you.
Statistics can be useful to help you understand and improve your organizational skills (your usual work pace, your professional/personal balance, etc.)
Statistics are available on the web version and in the Beesbusy mobile application.