You can notice 4 items that allow you to change the information displayed in this view at the bottom of the page.
From left to right :
The drop-down menu of timelogs display

This drop-down menu allows you to display different time totals to the right of the task title (see time framed in orange).
As in the picture above, you can for example compare the initial time, i. e. the workload to be distributed over the tasks, with the time that has actually been planned, in order to be sure that the entire estimated workload has been planned.
The « Project total VS Global total » button

This button allows you to choose to display the members’ workload in two different ways :
- Global total: display of the members’ availability taking into account the workload of all the projects affecting them.
- Project total: display of the members’ availability taking into account only the project’s workloads displayed.
The « Planned timelog VS Achieved timelog » button

This button allows you to display on the tasks of the project:
- Planned timelogs, i.e the estimated workload of the resources.
- Achieved timelogs, i.e the actual time spent by the resources on their tasks.
The period selector
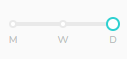
This selector allows you to display the availability pie chart of the resources either by day or by week, in which it is positioned on Monday, or by month, in which it is positioned on the first day of each month.