Beesbusy proposes you to plan your time with functionalities which adapt to the needs of all the teams.
You can simply schedule tasks in time (start date and/or end date) by assigning members of your team.
The workload for a member may then be considered equivalent to the duration of the task.
You also have the option of dissociating the duration of the task from the workload of members on that task.
For example:
Duration of the task: 5 days.
Workload for a member assigned to this task = 3 days.
Beesbusy allows you to manage times globally or plan them in detail and to have exportable copy in Excel or CSV format.
Global approach
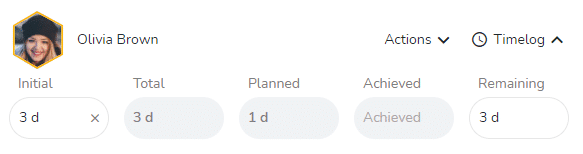
You can set an initial/predictive workload for each member of the task.
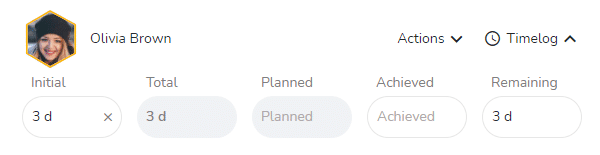
Each member can log their Achieved Time globally on the task and change the Remaining Time if necessary.
Beesbusy automatically calculates the % progress of the task.

Detailed approach
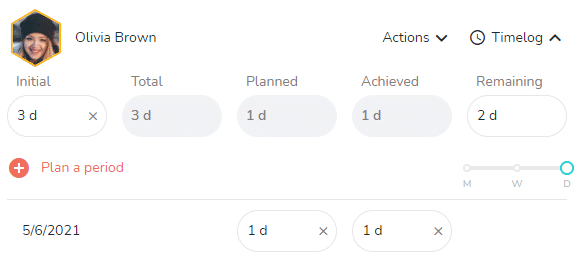
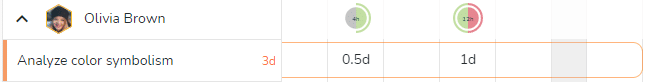
You can schedule each member’s time (in hours or days) per day, per week or per month based on your input and track method.
- You can see the member’s availability (occupancy rate) in real time when planning.
Compare Total Time and Planned Time to make sure you plan the time needed for each member to complete the task.
- It is necessary to plan another 2 days in the above example.
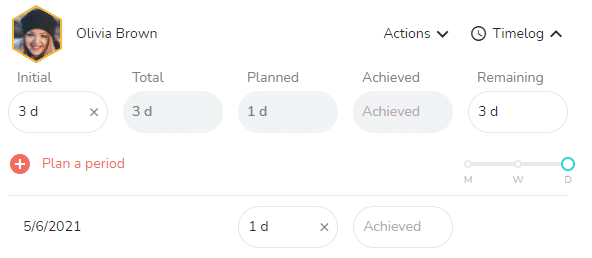
Each member can log Achieved Time per day, per week or per month according to your needs.
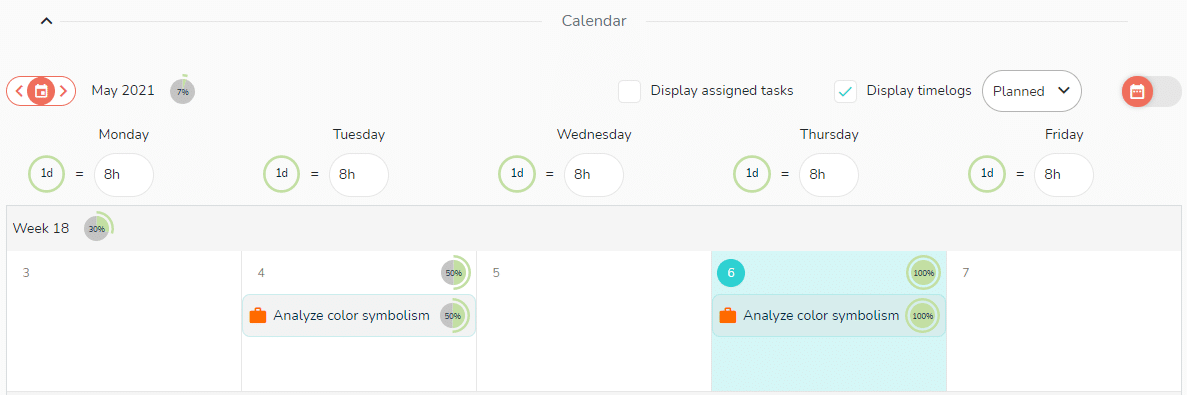
You can visualize the interventions of each member on the schedule of the project knowing that a member may continuously intervene on the task.

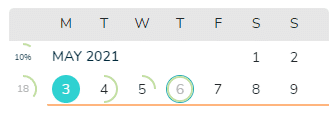
You have the possibility to allocate the member’s workload directly on the schedule and visualize in real time the overall occupancy rate on the project or all projects.
- In the example above, Beesbusy highlights in red the 0.5 day overload as the member is already scheduled for one day on that date.
You can also view each member’s schedule with the tasks they are working on day by day and their occupancy rate by day, week or month.
Reproductions
Whatever your approach, you have the possibility to visualize the planning and time management data through Excel exports:
By project
From the When view or the Who view, by clicking on the button at the top right:

The time export from the When view is presented by task list, while the time export from the Who view is presented by person.
On several projects
You can also extract all this data from the Gantt (sorted by tasks) and Calendars (sorted by people) views.
More articles like this:
5 tips to make the most of your summer vacation
Choosing a free software for your project management
Kevin’s guide to balancing work and family life
Peace of mind for your vacation
As an accountant and president of a soccer club, Olivier has a lot to manage
Elodie manages her businesses without giving up her free time
Julien’s 3 tips to save 30 minutes a day
Successfully manage your IT project